black and white bed linen

Liberdade Financeira

Dicas para Maximizar seus Ganhos

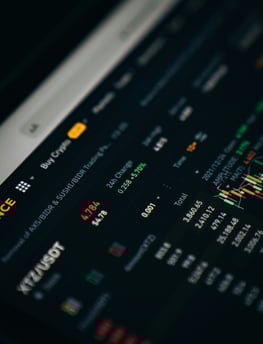
No Investidor Inteligente, oferecemos conteúdos práticos, notícias e análises para ajudar você a alcançar a liberdade financeira e investir com confiança.

A financial report is laid out with an intricate chart showing data trends over multiple years. Surrounding text appears to be in a newspaper format, with graphs and tables prominently displayed. The focus is on a detailed line graph illustrating fluctuations.

Quem Somos

Serviços Financeiros

Apoio completo para investidores em busca de liberdade financeira e decisões informadas sobre investimentos.

Consultoria Personalizada
Hands typing on a laptop keyboard with a screen displaying financial graphs and stock market data. Multiple charts and numbers are visible, indicating online trading or financial analysis.

Análises estratégicas e recomendações personalizadas para maximizar seus resultados financeiros e investimentos.

A person is looking at a computer screen displaying a document titled 'Overview - All Private Equity - Fundraising, Investments, & D'. The document contains statistical charts and graphs related to private equity market statistics from 2007 to 2022. Various tabs and functions like 'File', 'Home', 'Insert', and 'Design' are visible in the interface.
A person is typing on a MacBook Pro, viewing a website titled 'Personalize your portfolio.' The webpage displays three sections related to investing, each with different images and text. The laptop is on a grey table with a dark sofa and indoor plants in the background.
Conteúdos Educativos

Artigos práticos sobre finanças pessoais, mercado de ações e investimentos para capacitar investidores.

Ferramentas e Insights

Recursos valiosos para auxiliar na construção de um futuro financeiro sólido e sustentável.

Avaliações Clientes

Veja o que nossos leitores dizem sobre liberdade financeira e investimentos.

O Investidor Inteligente me ajudou a entender melhor o mercado financeiro e a investir com confiança.

João Silva
A close-up of a printed financial newspaper or report featuring numbers and text organized in columns and rows. There is a percentage symbol placed within a red circle on a green background, possibly indicating financial data or statistics.

São Paulo

Os conteúdos são práticos e me proporcionaram uma visão clara sobre investimentos. Recomendo para quem busca conhecimento e segurança financeira.

A laptop displaying a financial dashboard with various stock market graphs and data. The screen shows different stock indices and their performance, including line charts and a bar chart for market overview. The laptop is placed on a light-colored table, and a gray sofa is visible in the background.
Maria Costa

Rio Janeiro

★★★★★
★★★★★